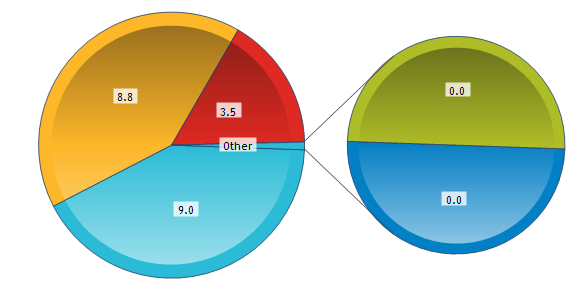
I've just submitted my continuous professional development records to the professional body I'm a member of. They use a rather clunky data entry web form, and once everything goes through you get some dashboards (of course!). The code behind dashboard generation is quite inflexible, it really couldn't believe I would give it zero for red, blue and green metrics, so it still zooms on them in a second pie chart, where 3 zeroes take a third of the pie each. Is there an official name for this shaded pie-chart? Soup bowl perhaps?
My recorded CPD hours can be compared to the whole set of the same membership category as me, whose results come in pie charts.
 |
| set mean |
 |
| set median |
Now something interesting is happening here, as the median of blue and green is 0 while the mean is non zero. This means at least half the members in the set have done zero blue and zero green hours, much like myself. Also hilariously the sum of the median hours is less than the obligatory 30. This goes to show why it is such a bad idea to do a pie chart of medians, as a pie chart implies a total value for the whole pie with some real meaning.
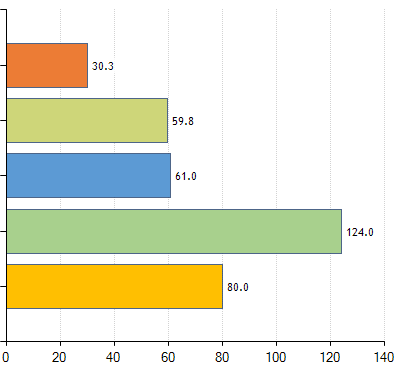
Now going to the bar chart showing all categories with a choice of metric between Mode, Mean and Median. Mode is a really odd choice for what is really a continuous metric, and sure enough, by selecting it I get an error:
One or more CPD Hours sets has no single modal value
The means and the medians are shown below
 |
| Mean |
 |
| Median |
The meager 30.3 is me. The dark green has the same mean and median (124) so I would hazard a guess that it is a set of only one member, especially given the mean is round. It's interesting that for the other sets the median is just over half the mean, but we know that at this point they might also have very few members values all over the place. Or an uber keen minority in each set is skewing the mean upwards.
The blue is my set. The mean of 107.2 matches the total of the set average pie chart. That is not the case with the median, but of course the sum of medians is not the median of the sums, whereas the sum of averages is the average of the sums. The fact the sum of medians is actually much smaller than the median of sums, shows us that most members of the set don't divide their time equally. There's scope for a whole other post on statistics of statistics here, I'll do that some other time.


No comments:
Post a Comment
Note: only a member of this blog may post a comment.