As always, a couple of calculated fields come handy.
Truncated Latitude and Longitude:
int([Latitude])
int([Longitude])Aggregate the number of responses and force a logarithmic colour scale, with appropriate legend:
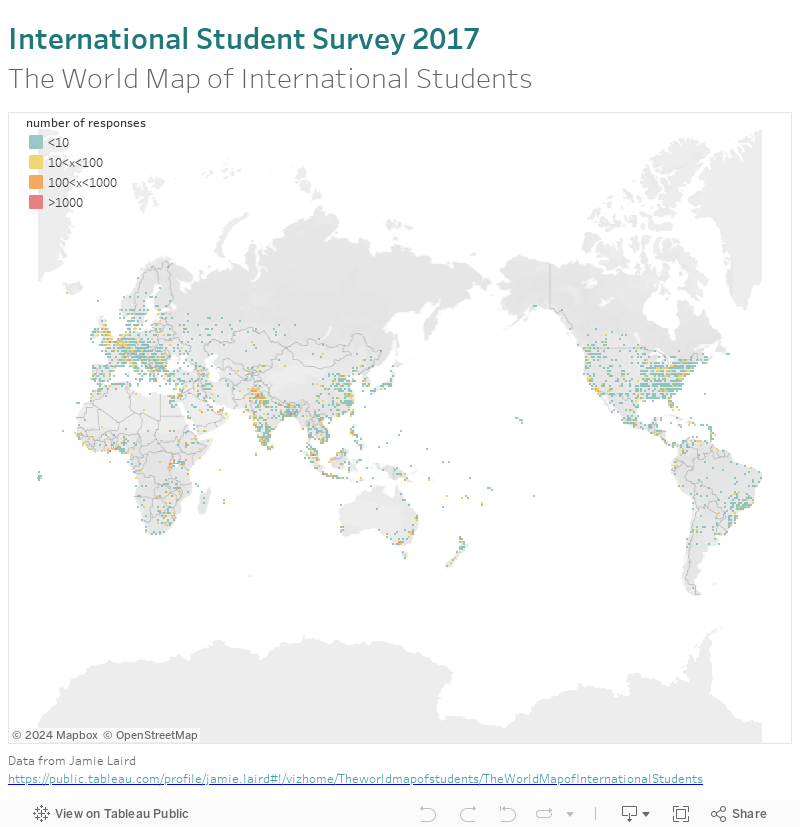
case int(log(COUNTD([Response ID])))
when 0 then '<10'
when 1 then '10<x<100'
when 2 then '100<x<1000'
when 3 then '>1000'
end
Some footnotes on presentation: make sure you have no border or halo on the marks (controlled through colour), and if you really want to treat the marks as individual pixels use the square mark type.
No comments:
Post a Comment
Note: only a member of this blog may post a comment.