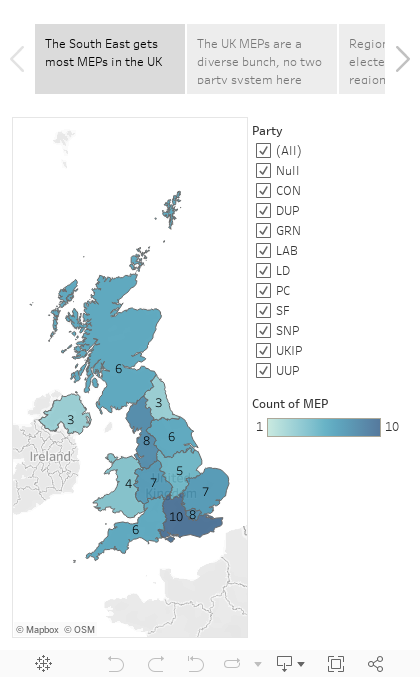
After a bit of copy paste from online sources, I created a list of UK MEPs, and a list of local authorities in England as well as the 3 devolved administrations of Scotland, Wales and Northern Ireland, which I used for the visualisation below. I will revisit this in future posts for a detailed 'how to'. For the moment I'd like to draw your attention to the fact that any statistics here are based on the number of elected MEPs of each party in each region, and not the actual votes counted.
I devise a numerical scale to map parties left to right, which is by its very nature arbitrary, and specific to the time (2014) and place (i.e. a UK definition of centre right can be quite different from a French one). I thought it was fair enough to put Lib Dems in the centre after their coalition time, and Labour and Conservatives (including the Ulster Unionists) on either side, with UKIP further right, the regional parties and greens on the left, and the two main parties of Northern Ireland defining far left and far right. Averaging this numerical value of the MEPs of a particular region is used to place it on the Left-Right spectrum, though a closer look at similar scoring regions shows vast differences that can be summarised by the same statistics!
No comments:
Post a Comment
Note: only a member of this blog may post a comment.