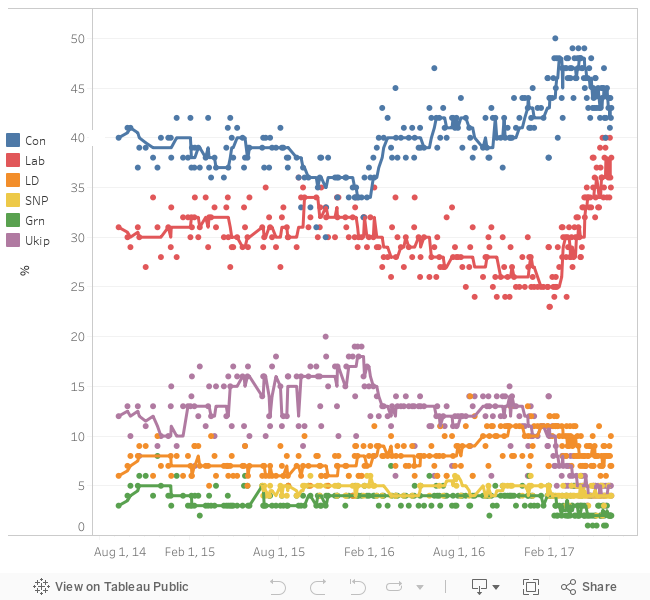
Guerrilla techniques for data analysis and mapping. Any opinions are my own and not my current or former employer's
Showing posts with label news graphics. Show all posts
Friday, 4 May 2018
Sunday, 11 June 2017
Pollster pollster, what do you know?
It's been quite a while since I put something on Tableau public. Once I saw this I couldn't resist. I can't quite get the trend line right, but let that be an exercise for the reader :)
Saturday, 29 April 2017
Cambridgeshire and Peterborough is a two horse race
In the wider context of the cult of the leader/CTO, Cambridgeshire and the Peterborough unitary authority are bundled together for a devolved mayor election, with a budget for the mayor to tackle housing and transport. To her credit, the green candidate at least proposes forming an assembly to keep this leader in check, but there is little chance of a green mayor. Local election literature told us time and again that it's a two horse race. But which two horses?
Labour have been using the only previous result that covers the same geographical area with a similar electoral process, and helpfully, shows them as the only ones that can beat the tory. They also foolishly put it on their website in jpeg format, with discrete cosine transform artifacts and all. Next time please use png guys!
But the mayor would have important make or break powers on a number of important issues. Houses in Cambridge are about as overpriced as in London. A new train station has led to redevelopment and price hikes in formerly affordable Chesterton as developers prepare to house even more London commuters. Peterborough of course has been discussed in the national press in a number of 'this is why Brexit happened' articles. This election is likely to be taken far more seriously by voters than the police and crime commissioner one in 2016.
On the other hand, Lib Dems are doing something even worse, using the Cambridgeshire county council results that wouldn't include any Peterborough votes at all. After all they still have residual support in Cambridge from back in the day when they were the anti-war, anti-fees party to the left of New Labour, whereas in Peterborough the Tories are much stronger, and they are a distant third party.
For more close monitoring of election visualisations, see Phil Rodgers' blog .
Saturday, 18 February 2017
The girl with the dragon infographic
I still haven't read 'The girl with the dragon tattoo'. I have read another book that wouldn't have been published without the Millennium trilogy's success, the biography of the author: Stieg, from activist to author. Stieg Larsson was a fascinating character, in some ways personifying the whole generation that came of age in the late sixties and early seventies.
He grew up in the north of Sweden, liked drawing and shortwave listening, and as a teenager became an activist against the Vietnam war. He did his military service after finishing school, some odd jobs, and spent a short stint in Eritrea training female guerrillas on mortars and getting very ill. Not quite the guerrilla techniques this blog is supposed to focus on, I hear you say.
So here's the twist: having returned to Sweden he moved to the capital, Stockholm and ended up with a temporary job for the press agency TT. Let's get the rest of the story from Jan-Erik Petersson's biography, in Tom Geddes' translation:
'At TT Stieg began by writing up sports results and the like until, standing in for a colleague, he had a chance to display his talent for illustrating articles with diagrams, boxes, and other devices, and this led to the offer of a permanent position. He was to stay with TT for twenty years.
Stieg Larsson had not studied journalism and had not been taken on as a reporter. He had created his own corner - news graphics - where he was something of a pioneer at TT. [...]Stieg dealt mainly with urgent jobs for news cables. If an aeroplane had crashed in Guadeloupe, he would draw a map of the area with the crash site marked in.
He worked on his own, producing maps, graphics and diagrams in the form of boxes and circles with his special tools - fine-nibbed pens, transfer letters, a caption machine, a scalpel. It was a real craft, at least until the late 1980s when Adobe introduced its Illustrator program.Sounds like the heroic age of mapping and data visualisation! Though as a Tableau warrior you can carve a similar niche in your organisation as the go-to person, especially for maps, if everyone else is using less capable tools. If you spend some effort to learn QGIS,even better! Stieg also put his skills in the service of the causes he believed in:
[in] the early 1980s, he was still active in the Socialist party and had begun writing for its weekly magazine Internationalen. He submitted articles on national service for women, on the New Age movement and superstition; he drew a map of US and Soviet military bases and nuclear weapons facilities throughout the world.You can get an anthology of Larsson's non fiction, The Expo files (with a Tariq Ali introduction, here's the Guardian review and the Telegraph review), but as the title suggests, it is focused on his writing for Expo, investigating neonazis. It does feature a piece on New Age from Internationalen, though unfortunately not the map of nuclear weapons facilities. Perhaps the next tribute publication after the Expo files and the autobiography could be a 'best of' his news graphics?
Subscribe to:
Comments (Atom)


