Sunday, 8 September 2019

Ofcom's media nations report: Bar chart epic fail

As a designer of interactive visualisations you have great power and great responsibility to stop the user from doing stupid things. Whoever put Ofcom's media nations report together on Power BI, left the option to the user to tick plotting the responses to multiple questions, with the percentages going well above 100%. I'm not familiar enough with Power BI to know if this is the fault of the software rather than the designer.
And the magic setting producing the magic plot (one of the questions only has answers for 2018-2019

Sunday, 11 August 2019

A sneak preview of the second Tableau Server Users Group meetup in London

Last month was the second  London Tableau server users group meetup. Jonathan MacDonald went through a long list of tips and tricks for server users and administrators, a few I knew already but also an awful lot that I didn't.

I won't go through all of them, as I wasn't writing them down, or snapping a pic for every single one. I did take the following two pics though. The first trick is that you can append filters to the URL:
and the second one is that you can access an xml containing the server status again through a URL

Friday, 9 August 2019

Extracting the list of coordinates for geographic role 'airport' out of Tableau

Don't they say a picture is a thousand words? All you have to do is navigate to 
C:\Program Files\Tableau\Tableau Public 2019.2\local\data
(modify appropriately for Tableau desktop). Copy the airport tableau source and the GEOCODING database into another folder, drag and drop the tds on tableau and voila, you have the airports and their coordinates! You can even export them to csv for general purpose use.


Sunday, 30 June 2019

Workarounds for getting new 2019.3 features in earlier versions

The 2019.3 beta is out and here's the list of new features. It's nice of Tableau to automate some of the things that could be done with workarounds in previous versions. If you like the new features but are stuck in an old version, or if you are a new kid wanting to know how things were done in ye olden days, follow the links below:
Distance between two points as a calculation
Working with data in UK national grid projected coordinates (haven't tried this script in TabPy to see how slow it would be, worked fine as a standalone python script for data preprocessing)
Pdf subscriptions (courtesy of Interworks)

Sunday, 17 February 2019

Tableau public 2019.1 allows for powerpoint export

You will have noticed, dear reader, that a lot of the images I use in the blog are screenshots of the workbook while it's being edited in Tableau Public, before publishing. Tableau has spared a thought for those like me, and from the latest version allows me to export to PowerPoint even before publishing to Tableau Public.

So from this :
we go to this:
It is basically a powerpoint with the image exports of the sheets, but still quite handy! As a general rule when I want to put Tableau visualisations into powerpoint I observe two rules:
  1. Export the view and legend(s) separately into separate png files, so that the legend does not become diminutively small
  2. When resizing the inserted png file, make sure I keep the aspect ratio of the original.

Tuesday, 25 December 2018

Managing the monthly Flow allocation using a scheduled ftp file grab

Running a flow for every new file in the FTP repository is eating away my monthly allowance
Therefore since I'm not interested in real time monitoring, a more efficient approach is to only fetch files once a day. Note that the ftp directory list gives a body on which we can run a 'foreach' loop, to then only select the wanted files whose filenames satisfy the condition.
If you got this far, Merry Xmas!!!

Sunday, 23 December 2018

FTP fetching and maintaining filename with Microsoft Flow

In previous posts I looked at grabbing web content with microsoft flow on a scheduled trigger, and triggering similar website grabs from RSS feeds. A more old fashioned scenario involves downloading files from an FTP server. In that case the content already exists in the form of a file and has a filename, so there is no need to 'construct' a unique filename, we can simply name it in the same way that it is named on the server. On the other hand, this can be seen as an advantage over traditional ftp clients in that we can actually rename our files based on our own convention rather than be forced to keep the original filenames.
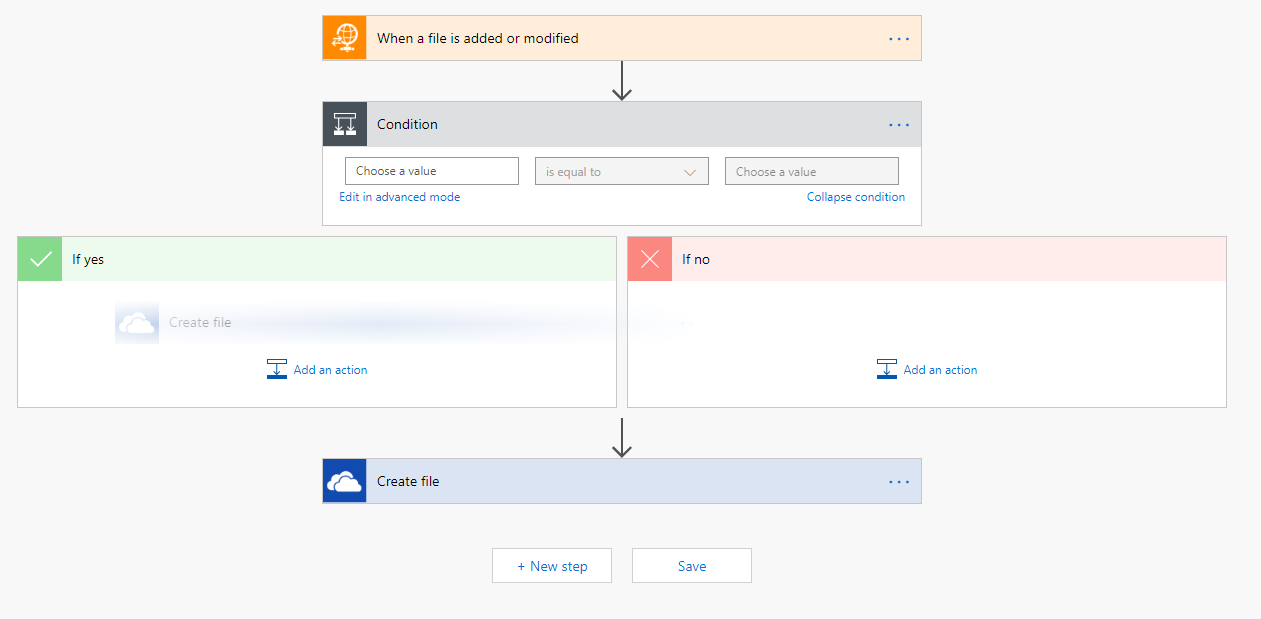
Finally, having changed my mind about downloading all files and wanting to introduce a condition, I find that I was wrong in my previous post, I can drag and drop the create file component inside the 'yes' outcome of the condition.


Monday, 17 December 2018

Operational Intelligence basics: Looking for data loss with a scheduled data feed

It is worrying how many people, from the novice visualisation enthusiast to the experienced data scientist, just assume all is well with the underlying dataset and go on to visualise it, feed it through algorithms etc. 

My first use of Flow was to capture DX cluster data. I was requesting an XML every few hours, which contained 500 records. Now the websource is designed for near real time monitoring, not for people like me to download a complete archive. So sometimes 500 records do not go far back enough to avoid having a gap with the previous fetch, as is shown in the morning of the 9th December below. Colouring by the filename (effectively the date and time of fetch) helpfully shows that the gap corresponds to a colour change, and very possibly means there was data loss. On the other hand the gap on the 12th December happens 'within' a particular colour band, i.e. in the middle of a fetched file. So it is probably a genuine lack of activity rather than data loss. I have subsequently changed my flow to do more frequent fetches. 

But what about the actual lack of activity? We look in a bit more detail by adding frequency in 10s f kHz on the vertical axis and being a bit more careful about accuracy of the thickness on the horizontal axis using the calculated field constant 1/(24*60) for the minute.
Now compare this slow dying down and picking up again to a data gap below:

Sunday, 16 December 2018

Conditionals in Microsoft Flow for RSS feed processing

For the Flow aficionados amongst you, check out the Flow online conference videos on YouTube.
 
I've referred to the golden age of web 2.0 in Yahoo! in a previous post. One of the cool products of that time was Yahoo! Pipes that provided effectively pipework for RSS feeds. 

With similar applications in mind, Microsoft flow can be a worthy replacement. I needed to only retrieve the web page linked from an RSS feed if the title contains a particular keyword. See the screenshot below. The flow web editor does not allow for dragging and dropping an action into the alternative paths following the conditional. I guess this will be a possibility when editing Flows in Visio becomes available. This might look like a peculiar combination to those of us who think of Visio as a tool for drawing diagrams, but Visio already has Sharepoint workflow functionality, and Microsoft Flow is to replace Sharepoint workflows as you'll hear in the conference videos.


Monday, 10 December 2018

Using Excel to turn XML format data into a table

Back in the early noughties when I was trying to learn a bit about web development, XML was all the rage. These days it has been displaced in various applications by json and other formats. Configs, that should have been safe XML territory, are also threatened by json, with Microsoft Flow being an example of such use of json. Even so, a number of legacy uses of XML are still going and it is worth being able to decipher it.

Of course you could simply open an XML file in an editor and do lots of manual editing to turn it into csv. At the other end of the spectrum, scripting languages are good at parsing this format. I have found the Python XML Element Tree library useful for that.

A middle road exists, which is to simply drag and drop the file on Excel. This functionality is hardly surprising given that the excel file format itself is based on XML. Using this example data: http://dxlite.g7vjr.org/?band=vhf&limit=500&xml=1
Ignore the style pop up question, then you get a few options:
and finally a warning about schema.
Sticking with all the defaults results in the desired table in excel
Things of course will be more complicated with more complicated XML data, and it will be worth looking at the file in an editor, and considering using a proper script to convert it. But excel can be a useful quick and dirty solution.

Saturday, 8 December 2018

Fixing the flaws of Flow

In a previous post I complained about Flow not being able to compress files on the go. The issue with that was that as my files were not stored locally by default, once I started the archiving process with 7zip it would first cause the download of the file locally, then add it to the archive. Often with a flaky network something would disrupt the download, which would then mess up with the archive. The workaround has been to specify that all the files in that folder are stored locally, thus decoupling the download from the archiving.

I know, not something to write home about. Let's look at the config of the HTTP component in more detail. Oops! There is an automatic decompression button set to 'On' by default! Make sure it's off unless you really want decompression.

As I had a few failed runs, I've changed the retry policy, from the exponential default starting with an interval of seconds, to a fixed interval with quite a few minutes interval. I find this works better for a website that has gone temporarily down, especially given that I don't particularly want the flow to be responding in real time. The fact that this can be done from inside the config rather than by adding more steps to the flow is something I learned from the great Serge Luca in his Sharepoint Saturday presentation.

Friday, 24 August 2018

Unknown region breaks map in Blogger's Audience stats

Blogging is all about vanity in the end, and to flatter ourselves we check on the audience stats provided by Blogger from time to time. Today I notice something rather peculiar: as I fiddle with the time-span (day, week, month) I notice that the maps works fine when it knows the countries in question.
But lately 'unknown region' has been showing up, and that seems to destroy the map altogether, so no country is coloured anymore. Tableau would have happily warned me of one null while still colouring all other countries.

Saturday, 18 August 2018

The flaws of Flow: Can't zip downloaded files

Microsoft Flow has been proving more useful in my Office 365 dominated environment. I've been using the FTP connector to download masses of files to my OneDrive. The OneDrive comes with a 1 TB limit, which is plenty but it is worth trying to keep things compact. Unfortunately, while flow can extract from zipped archives, it can't do the opposite. In order to manually create a zipped archive, the computer downloads all the files, zips them and uploads them back to OneDrive. Gotta love Microsoft!

Sunday, 29 July 2018

Microsoft flow as a last resort in place of cron and windows scheduler

You know the situation: while you are not the biggest fan of MS out there, your employer's IT department are. Of course you don't really have proper access to a Linux system to set up a cronjob to do your data fetching for you, and you don't even have an 'always on' windows machine to be able to do this via Task Scheduler.

Well, you have to make do with what you have, and in this case, that is Office 365, a lesser known component of it called Flow. There is an upside to this to rescue your pride somewhat: while it is a humble office app it uses the same language as azure logic apps, so think of it as cloud training!

Tuesday, 17 July 2018

Using Post code Sector GeoJson from TableauMapping.bi

Ok, so this time I'm using https://www.tableaumapping.bi/ properly. I connect using the web connector from tableau Public to https://www.tableaumapping.bi/wdc and chose the Post code Sector table. I then blend in my own data with post code addresses. I use a calculated field to generate the sector from the full post code in my data:
left([postcode],len([postcode])-2) 
and voila! a much more detailed map than the one I got before using only the first half of the postcode.

Strange maps courtesy of Tableau mapping BI

While fooling around with the otherwise worthwhile https://www.tableaumapping.bi website last night, I managed to get it into a state producing some rather interesting maps. The one below shows the UK ceremonial counties trampling over Iceland (cod wars all over again!). 
Another one shows the Bristol channel housing the whole of the EU and a few fellow travellers broken down to NUTS 2!
I'm having trouble reproducing the behaviour today, they might have fixed it!

Monday, 16 July 2018

British MEPs go NUTS

I know what you are thinking, the European Parliament has more than its fair share of nutcases but this is about NUTS as in Nomenclature des unités territoriales statistiques  which are defined across Europe, but we'll take the UK as a case study.

A year and a half ago I looked into grouping counties and unitary authorities together in Tableau to form the European election constituencies in England. This takes a fair amount of work, and I had a dodgy solution with dual axis to avoid having to also group all Scottish, Welsh and Northern Irish counties in a similar way.

A much simpler solution using the latest Tableau functionality is to use NUTS as geographic role. This avoids needing a source to define the constituencies at all, so the data source of the MEPs of each region is enough to also generate maps.

Saturday, 7 July 2018

Splitting the prefix out of a british postcode with no spaces

I came across a dataset this week that had postcodes in this format
Tableau only understands the first half of the postcode, but how do we split it out? Wikipedia as always has a fairly comprehensive description: The outward code (i.e first half) can be from 2 to four characters, but the inward code (second half) is always three characters. Therefore we can isolate the outward code with a calculation:
left([Post Code],len([Post Code])-3)
This now gives the outward code alone in a field that can be given a post code geographic role and  used with the filled map mark type.
And if you do spatial analysis, that little anomaly on the river Thames would have caught your attention. Lets add place names and streets in the map layers and zoom in:

Sunday, 3 June 2018

Simultaneous gantt objects (2018.1 update of using pivot with contracts)

My second post more than a year ago looked at how we find simultaneous gantt type objects. While the method for data preparation still stands, the final plot can be refined a bit thanks to the latest tableau update, the step line type
This now gives a more realistic depiction of the number of concurrent objects and how they change, as it is going to be a step change through integer values rather than a ramp up.