Saturday, 25 November 2017

Converting hexadecimal values in Tableau

While Tableau has a lot of basic maths and string functions, coping with hexadecimal numbers is not something it can do natively. Let's see how we can do this with calculated fields.

To make the solution easier we break the problem into two: Interpret each hexadecimal digit, and then put the results together to convert the whole number to decimal. We create a calculated field for the rightmost hex digit (1s)
ifnull(int(right([Hex No],1)), 
case right([Hex No],1) 
when 'a' then 10 
when 'b' then 11 
when 'c' then 12 
when 'd' then 13 
when 'e' then 14 
when 'f' then 15 
end)
We do the same for the next digit (16s) where we can use mid([Hex No],5,1) assuming our numbers are in the format 0x023c. Likewise for the next two digits, 16^2s and 16^3s. Then we bring everything together:
[16^3s]*16*16*16+[16^2s]*16*16+[16s]*16+[1s]

Sunday, 12 November 2017

Working with Eurostat unemployment data in Tableau

Eurostat publishes among other things, unemployment data for the EU. The data is in a weird format, a hybrid between tab and comma separated values.
Having turned it into proper comma separated format, we remove the colons and pivot the years to get a more tableau friendly format:
While the year and quarter can be split, a dateparse calculation is more helpful:
dateparse("yyyy'Q'q",[Pivot Field Names])
 This finally allows us to do some analysis, looking at the unemployment trend for the ten countries of the 2004 accession. Cyprus which I've chosen to highlight is a definite outlier.
It had relatively low unemployment before entering the EU, has a fairly mild recession until the greek PSI when unemployment rises and rises, until the final bail in and associated bank collapse in 2013. This was a double dip, or in the case of unemployment, double peak situation, with the situation improving only to become worse again around the end of 2014 and beginning of 2015. Croatia was the only country of the group in a worse situation until Q3 2016 when the two cross over.  

Sunday, 22 October 2017

Work around for problems with Split function when connecting Tableau to PostgreSQL

I'm a big fan of the split function when doing calculated fields. Partly because far too often, the fields from the sources I work with are concatenations of other fields, or even because I've done a union of several CSV sources and some crucial bit of information is hidden in the table name/path. But recently I tried to use this with PostgreSQL and I got the following error
  • ERROR: function split_part(text[], unknown, integer) does not exist; Error while executing the query
Now I could investigate this further on the PostgreSQL side of things but I just want to get my thing to work and move on. So instead here's the workaround I came up with:
mid([concat_str],start_of_split, find([concat_str],'/',start_of_split)-start_of_split)
where start_of_split is a fixed number of characters (maybe you want to do another find here) and '/' defines the delimiter to use when splitting.

Sunday, 20 August 2017

Tableau and negative zero

Another saga from the big data frontier: at work we have a source of GPS data, and I've been working with a colleague to aggregate it to a degree grid, not unlike the example linked. The data is in hive, and bizarrely it has two columns for each dimension, latitude magnitude as a positive float, and latitude sense as a string (N or S) etc. for longitude. To make our life simple we round the magnitude in the custom SQL that connects to hive, and we make the data signed again with a simple calculation in the Tableau source:
[round Latitude magnitude]*
(case [latitude sense]when 'S' then -1
when 'N' then 1
end)
The rounding of the magnitude is fine as we also keep the sense in the group by dimensions in the custom SQL. The only special case here is when the rounded magnitude is zero, where had we done the sign assignment before the rounding, we'd have one bucket for zero instead of one for 0-0.5 and one for -0.5-0. But surely that shouldn't be an issue once we do the calculation above in tableau?

It turns out that it is an issue. I'm not sure what's happening in the data engine (two's complement going crazy because of negative zero?) but the two zeros are treated differently, recreated with the data of the post linked above.
 Sure enough, looking at the two zeros there's one for -0 and one for +0. So we refine our calculation to avoid multiplying zero by -1

if [round Longitude magnitude]=0 then 0 else
[round Longitude magnitude]*
(case [longitude sense]
when 'W' then -1
when 'E' then 1
end)
end 

Sunday, 11 June 2017

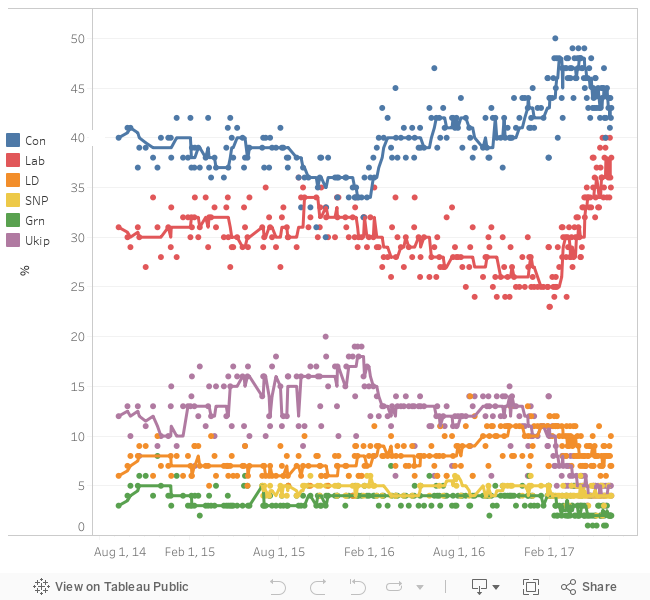
Pollster pollster, what do you know?

It's been quite a while since I put something on Tableau public. Once I saw this I couldn't resist. I can't quite get the trend line right, but let that be an exercise for the reader :)


Saturday, 27 May 2017

A green electoral trend

The bar chart below, from Green party leaflets, is very interesting. The argument here is that the share of their vote is growing and voting for them is not a lost vote. I have a lot of sympathy for the argument for proportional representation. The 2015 British national election was a joke, with UKIP being a third party in votes but not in seats, and SNP benefiting massively from first past the post to get a monopoly of Scottish seats that is not quite reflected in the vote counts. 
However, this chart poses a few questions for me. Sure, the green vote grew from 2010 to 2015, but was it a one off that cannot be projected into further growth for 2017? 
After all 2015 was the fall of the LibDems, and those voters who felt betrayed by Clegg but hadn't forgiven Labour either could vote Green. The situation of course is very different now, with Labour breaking away entirely from the Blairite past while the LibDems are trying to capitalise on the 48% Remain vote (by repeating the Guardian quote 'Corbyn betrayed us' among other things).
An equally interesting feature of this bar chart is the plateau from 2005 to 2010, which supports the argument that 2015 was an outlier and not the manifestation of an underlying trend. Last decade had very different priorities to the current one; the two big parties had largely taken on-board environmental concerns, the Tories even had a green tree as a logo (the same one that was repainted with the union jack recently), and even though the economic crisis was obvious at the end of the decade, the political priorities took a while to change. So maybe 2010 is the outlier, and the trend is there.
We'll only know once the 2017 results are out!

Sunday, 14 May 2017

The Tory deficit

So, another month, another election campaign. Cambridge is a two horse race again, this time there is no dispute on which parties are the two horses, as in the little snippet I scanned from the latest LibDem leaflet. But what about that black arrow over the blue bar? That's what I call 'the Tory deficit'. Not the financial deficit but the one of votes. Or is it?
Let's think about this. The black arrow would bring the Cons up to about 34%. Then the total would be 34+35+36=105% and that's without counting the small parties. I'm also not convinced the bars start from zero, but it's quite hard to compare the length of the arrow against the length of the bars. 
In terms of electoral rhetoric, 'Jeremy Corybn's (sic) candidate' is an interesting choice. Julian Huppert very much lost in 2015 because he was 'Nick Clegg's candidate'. Of course the Liberals are pushing the argument a bit too much by saying (in a previous leaflet that went to recycling without stopping by the scanner) 'Don't vote Tory, you might get Corbyn!